Sign Up
School Account Sign Up
Lesson ID: 13757
To begin to understand a data set, statisticians look at center, spread, and shape. This lesson will explore variance and standard deviation as measures of spread.


He thought he could cross because it was only a foot and a half deep on average.

Clearly knowing the average depth of the river didn't give that statistician enough information.

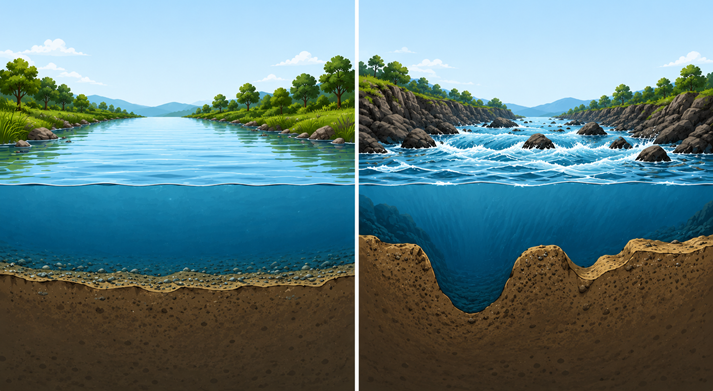
Maybe there is a sharp drop-off in the middle of the river and then a very shallow sandbar. Consider these two scenarios:
The average depth of the river is 1.5 feet.
However, with a depth of 3.5 feet at one point in the river, the statistician will get pretty wet. That's because the data are fairly spread out.
Again, the average depth of the river is 1.5 feet.
However, he won't get as wet because there is much less spread to the data.
We need more than just a measure of average, called mean in statistics, to have enough information about a set of data.
This is where variance and standard deviation come in. They are two measures of variation, closely tied together as you will see, that give information about the spread of data around the mean.
Begin with the idea of variation in data.
Not all data sets behave the same way, even when they have the same average.
Imagine two students taking five math quizzes.
Student A scores: 70, 70, 70, 70, 70
Student B scores: 40, 60, 70, 80, 100
Both students have the same mean score of 70.
However, those scores tell two very different stories.
Student A is extremely consistent. Every score stays exactly the same.
Student B has huge swings between low and high scores. That difference is called variability.
Variability describes how spread out the data points are in a data set.
When data points stay close to the mean, the variability is low.
When data points are far from the mean, the variability is high.
Statisticians measure this spread by looking at deviations.
A deviation is the distance between a data point and the mean.
The formula for a deviation measures how far a data point is from the average:
Deviation = data point - mean
For example, suppose the mean quiz score is 70.
If a student scored 85:
85 - 70 = 15
The deviation is +15 because the score is above the mean.
If another student scored 60:
60 - 70 = -10
The deviation is ?10 because the score is below the mean.
Positive and negative deviations help show whether values fall above or below the average.
Return to the river example.
River A depths: 0.5, 3.5, 2.5, 0.75, 0.25
River B depths: 1, 1.5, 2, 1.75, 1.25
Both rivers have the same mean depth of 1.5 feet.
However, River A has much larger deviations from the mean. Some spots are extremely shallow, while others are much deeper.
River B stays much closer to the average depth throughout the river.
That means River A has greater variability.
Understanding variability helps statisticians make better predictions and avoid surprises. Averages alone cannot always tell the whole story.
With that introduction to the idea of variability, let's take it a step further.
We can talk about variability by talking about the deviations of each data point, but for a large data set, that's a lot of numbers.
What would be most helpful is a single number that summarizes all of those deviations. We have one! It's called the standard deviation.
Simply put, the standard deviation measures how far data values typically spread from the mean.
Here are the steps to calculating a standard deviation from a data set:
Now it is time to put all of those steps together.
Use the first river example to calculate the sample standard deviation step by step.
River depths: 0.5, 3.5, 2.5, 0.75, 0.25
Step 1
Find the mean.
Add the numbers together and divide by 5.
Mean = (0.5 + 3.5 + 2.5 + 0.75 + 0.25) / 5
Mean = 1.5
The mean depth is 1.5 feet.
Step 2
Find each deviation from the mean.
Subtract 1.5 from every data point.
0.5 - 1.5 = -1
3.5 - 1.5 = 2
2.5 - 1.5 = 1
0.75 - 1.5 = -0.75
0.25 - 1.5 = -1.25
Step 3
Square each deviation.
Squaring removes negative signs and gives more weight to larger differences.
(-1)(-1) = 1
2 x 2 = 4
1 x 1 = 1
(-0.75)(-0.75) = 0.5625
(-1.25)(-1.25) = 1.5625
Step 4
Add the squared deviations.
1 + 4 + 1 + 0.5625 + 1.5625 = 8.125
Step 5
Divide by the number of data points minus 1.
Since there are 5 data points:
5 - 1 = 4
Variance = 8.125 / 4
Variance = 2.03125
The variance is about 2.03.
Step 6
Find the standard deviation.
The standard deviation is the square root of the variance.
Standard deviation = square root of 2.03125
Standard deviation = about 1.43
The standard deviation is about 1.43 feet.
That number tells you the river depths usually vary by about 1.43 feet from the mean depth.
Now compare that to the second river:
1, 1.5, 2, 1.75, 1.25
This river has a standard deviation of only 0.40 feet.
Even though both rivers have the same average depth, the second river is much more consistent and predictable.
That is why standard deviation matters.
It helps you understand whether data points stay close to the average or spread far away from it.
In real life, statisticians use standard deviation to study weather patterns, sports performance, test scores, stock market behavior, manufacturing quality, and even social media trends.
Averages provide part of the story.
Standard deviation helps reveal the rest.

Let's go back to our statistician crossing the river.
In the first scenario, where the depths were much more spread out, the standard deviation is 1.43 feet and the variance is 2.04.
In the second scenario, the standard deviation is 0.40 and the variance is 0.16.
If he had the information about the standard deviation and variance of the data, the statistician would have sufficient information to avoid unexpected depths.

Now that you know what a standard deviation is and how to calculate one, go to the Got It! section to practice your new skills.


