Sign Up
School Account Sign Up
Lesson ID: 13773
Turn confusing scores into clear comparisons using z-scores—then test your skills with real-life data challenges.


How Do You Compare the “Uncomparable”?
Imagine this: one student scores a 740 on the SAT math section. Another scores a 33 on the ACT math section.

Here’s the problem: those scores live on completely different scales. Comparing them directly is like comparing inches to miles. It just doesn’t work.
You use something called a z-score.
What Is a Z-Score, Really?
A z-score tells you how far a value is from the average (mean), measured in standard deviations.
In plain terms, a z-score answers this question: How unusual is this value compared to everything else?
A z-score of 0 means the value is exactly average.
A positive z-score means the value is above average.
A negative z-score means the value is below average.
The bigger the number (positive or negative), the farther the value is from the mean.
Why Z-Scores Matter
Z-scores allow you to:
Compare values from completely different data sets.
Understand how extreme or typical a value is.
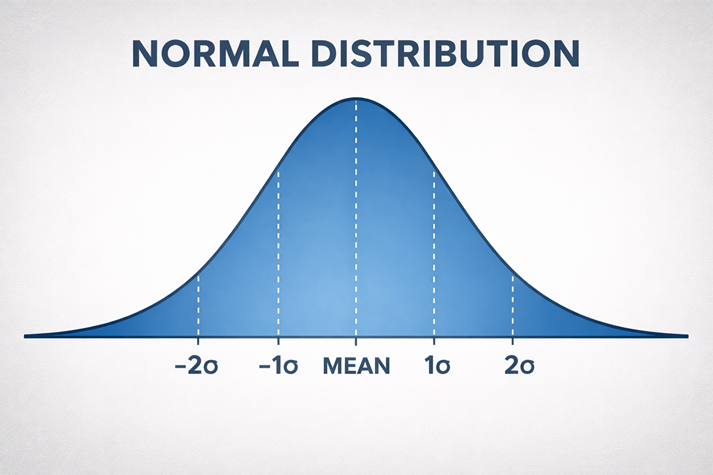
Analyze data that follows a normal distribution (the classic bell curve).
This is why z-scores show up everywhere—test scores, sports stats, psychology studies, and even business predictions.
The Formula You Need
To calculate a z-score, use this formula:
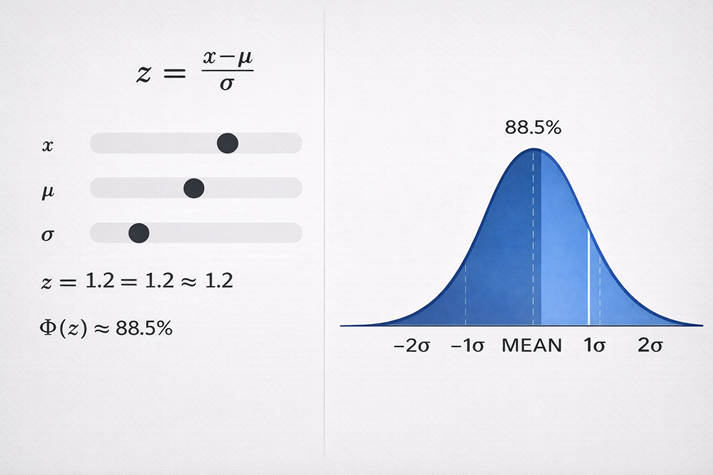
Here’s what each part means:
x = the value you are analyzing
? (mu) = the mean (average)
? (sigma) = the standard deviation
This formula measures how far your value is from the mean, then scales it by the spread of the data.
Step-by-Step: How to Find a Z-Score
Follow this process every time:
That’s it. No shortcuts needed.
Let’s Apply It
Go back to the test score example.
SAT math scores:
ACT math scores:
Now calculate.
SAT:
ACT:
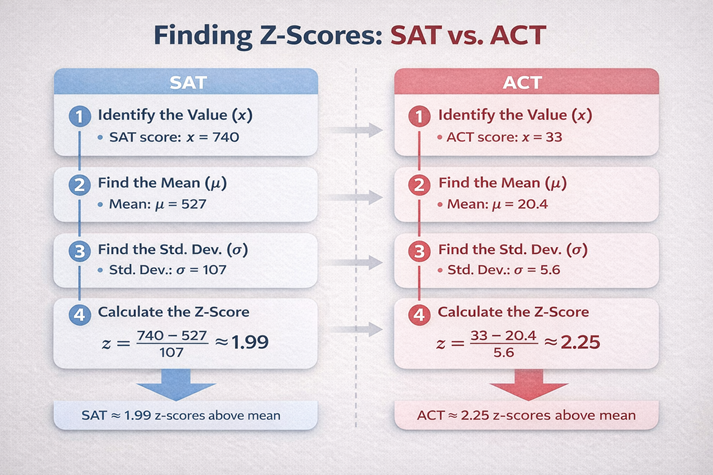
Even though 740 looks bigger than 33, the ACT score is actually more impressive relative to its distribution.
That’s the power of z-scores—they level the playing field.
Real-Life Thinking
Z-scores are not just about tests. They help answer questions like:
Once you understand z-scores, raw numbers stop being confusing—and start telling a clear story.
Wrapping It Up
Now you know how to:
Define a z-score.
Use the formula correctly.
Interpret what the result means.
Compare values across different scales.
Next, it’s time to put this into action. You’ll calculate z-scores, interpret results, and test your understanding with guided practice.

Supplies


