Sign Up
School Account Sign Up
Lesson ID: 10963
Discover hidden math patterns in nature, games, graphs, and real life while creating T-charts, ordered pairs, and cool projects!


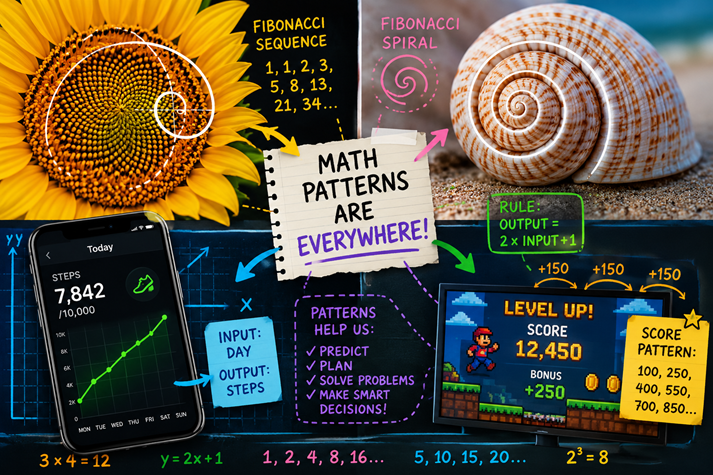
Video game scores grow in patterns. Music beats repeat in patterns. Weather data follows patterns. Even flower petals, pine cones, and seashells can follow mathematical rules!
Take a look at these examples.
A sunflower’s seeds spiral outward in repeating number patterns.
A fitness app tracks your daily steps using tables and graphs.
A streaming service recommends shows based on patterns in your viewing habits.
Architects and game designers use patterns to create balanced designs.
Math is not just about solving random problems on paper. Patterns help people predict, organize, and understand the world.
Cracking the Code of Patterns
A pattern is something that repeats or changes in a predictable way. In math, patterns often follow a rule.
A rule tells you what to do to a number.
For example:
Add 7
Multiply by 4
Subtract 5
Multiply by 2, then add 3
Math rules use two important ideas:
Input: the starting number
Output: the result after following the rule
Here is an example:
Rule: Add 7
| Input | Output | |
| 0 | 7 | |
| 1 | 8 | |
| 2 | 9 | |
| 3 | 10 |
The rule stays the same every time. The input changes, so the output changes too.
These input and output numbers create ordered pairs.
An ordered pair is written like this:
(0, 7)
The first number is always the input.
The second number is always the output.
Here are the ordered pairs from the table above:
(0, 7)
(1, 8)
(2, 9)
(3, 10)
Now look at another rule.
Rule: Multiply by 4
| Input | Output | |
| 0 | 0 | |
| 1 | 4 | |
| 2 | 8 | |
| 3 | 12 |
The ordered pairs are:
(0, 0)
(1, 4)
(2, 8)
(3, 12)
These patterns help mathematicians, scientists, engineers, coders, and designers make predictions and solve problems.
T-Charts Make Patterns Easy to See
One of the easiest ways to organize a pattern is with a T-chart.
A T-chart separates inputs from outputs so you can quickly spot the rule.
For example:
Rule: Multiply by 3
| Input | Output | |
| 3 | 9 | |
| 5 | 15 | |
| 8 | 24 | |
| 10 | 30 |
Each output is three times the input. Once you notice the rule, you can predict outputs for numbers not even listed in the chart.
If the input is 24:
24 × 3 = 72
So the output would be 72.
Patterns like these appear in real life all the time:
Calculating the total cost of movie tickets
Tracking distance traveled over time
Predicting population growth
Planning building materials for construction
Coding computer programs

Nature Loves Math
Some patterns appear naturally in the world around you.
One famous pattern is the Fibonacci Sequence.
The sequence starts like this:
1, 1, 2, 3, 5, 8, 13, 21...
Each number equals the sum of the two numbers before it.
Example:
1 + 1 = 2
1 + 2 = 3
2 + 3 = 5
3 + 5 = 8
This pattern was studied long ago in India and later introduced to Europe by a mathematician named Fibonacci.
What makes the Fibonacci Sequence so interesting is where it appears in nature.
You can often find Fibonacci numbers in:
Flower petals
Pine cones
Sunflower seed spirals
Some seashells
Branching plants
Scientists believe these patterns help plants pack seeds and leaves efficiently, allowing them to grow and capture sunlight more effectively.
Another pattern connected to Fibonacci numbers is called the Golden Ratio. This special ratio appears in art, architecture, and natural designs.
Even though nature is not “doing math homework,” repeating patterns help living things grow in organized and efficient ways.

From Tables to Graphs
Once you create ordered pairs, you can graph them.
A graph helps you see the shape of a pattern.
When graphing ordered pairs:
The input goes on the x-axis (horizontal axis).
The output goes on the y-axis (vertical axis).
Suppose these are your ordered pairs:
(1, 3)
(2, 3)
(3, 8)
(4, 12)
(5, 15)
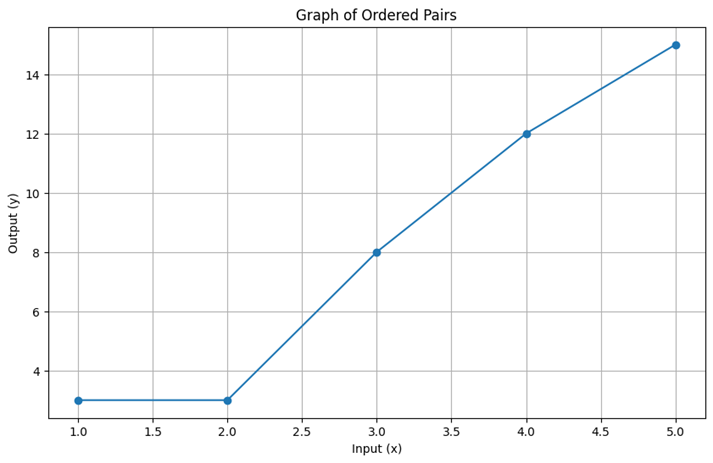
When you graph the points, you may notice they form a trend or shape.
Graphs help people understand information quickly. Meteorologists graph weather changes. Athletes graph their training progress. Businesses graph profits and sales. Doctors graph health data.
Patterns, tables, ordered pairs, and graphs all work together to tell a story using numbers.
Why Patterns Matter
Patterns are powerful because they help you predict what might happen next.
For example:
A scientist can predict climate trends.
A coach can track player improvement.
A game developer can create scoring systems.
An engineer can test designs safely.
A store owner can estimate future sales.
When you understand patterns, you can organize information, solve problems, and make smarter decisions.
That is a pretty useful superpower for a math lesson.
Now that you know how rules create patterns, how T-charts organize information, and how ordered pairs connect to graphs, it is time to practice spotting patterns and building your own.

Supplies


